Tutorial
Tutorial
- Introduction
- Sections
- Index
- Login
- Upload
- Public data sets
- Data Analysis and Visualization
- Tree visualization
- Operations
- Tables
- Distance Matrix
- Sequence Viewer
- Index
1 - INTRODUCTION
PHYLOViZ Online is a web application that provides a series of features regarding analysis and visualization of profile based typing methods. In this Tutorial you will find how to access and take advantage of those features by following the steps described below. In this tutorial, we will make use of MultiLocus Sequence Type (MLST) data from the following data set:
We will start by showing how users can access to public data or upload their own. Then we will give a tour on all the features and analysis that users can do with PHYLOViZ Online.
2 - SECTIONS
2.1 - Index
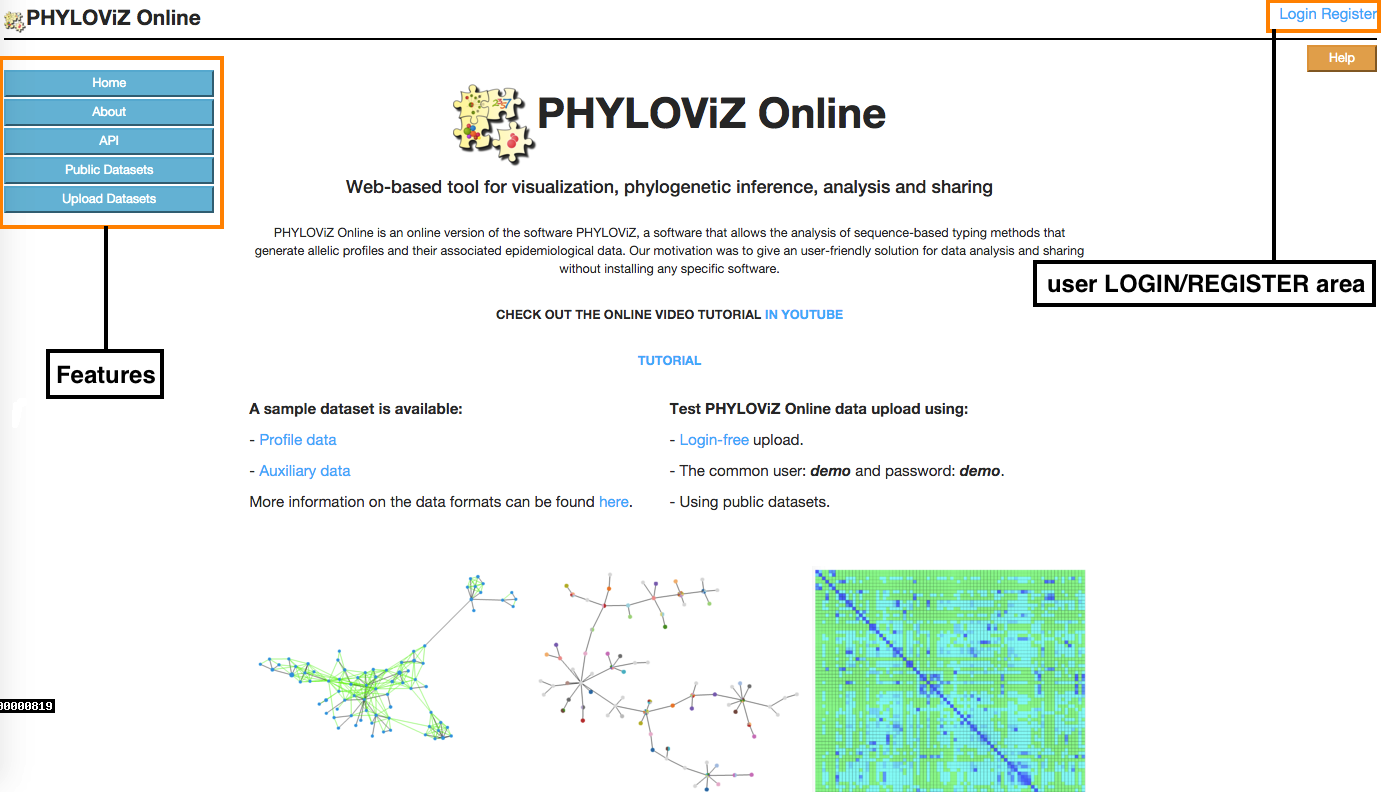
This is the starting page of the application. In the Index there is a Features menu in the left area of the page, where users can get information on the application or ways to access and upload data, and a user LOGIN/REGISTER area so they can access to their stored uploaded data.
2.1.1 - Login
By default, the application allows unregistered users to upload their data. This website is free and open to all users. However, data is erased 24 hours past upload time. To prevent this from happening, PHYLOViZ Online offers an option to create an account so that users can store their own data sets for future use.
Logging in
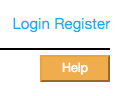
The Login/Register buttons are located at the upper right side of the application's main page. This options will lead you to a Login page or to the Registration page.
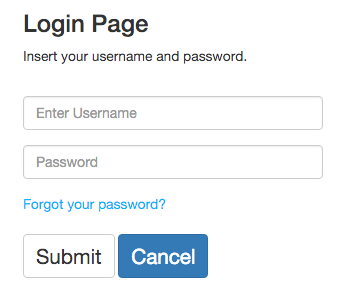
If users already have an account, they can access to it by typing its username and password. After that, they will be redirected to the application's index. If users forgot their password, select the "Forgot your password?" option.
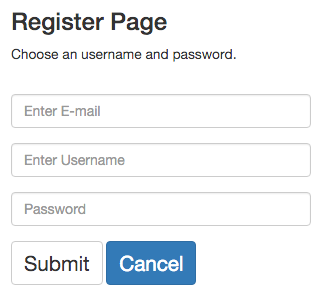
To register, simply select an e-mail, an username and a password. For each e-mail, only one account is allowed.
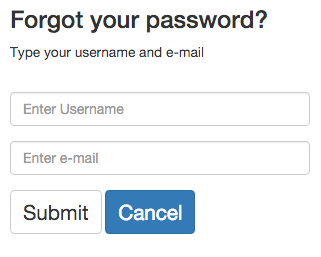
If users have an account but forgot their password, PHYLOViZ Online can re-assign a new password. Simple type your username and e-mail. After that, an e-mail will be sent with the new password.
2.1.2 - Upload
Data upload to PHYLOViZ Online can be made using one of two options: without registration (default), and with registration. With the first option, data sets can be used in a span time of 24 hours. After that, they are erased. In other hand, the registration option gives users access to an area where all their data sets are placed. They can manage and change permissions of their data so that other users can visualize it.
Data formats
The data that is used in the application is divided into two categories: data used to construct the Tree (profile, Fasta, or Newick), and auxiliary data. The auxiliary data is used to link information to the Tree nodes or Distance Matrix using its ID (the first column of each file). More information about data formats can be found here.
Data upload

To upload our data set, first we need to click on the Upload dataset at the Features menu.
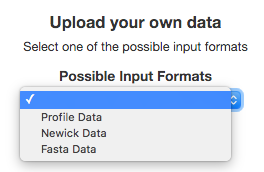
Then we need to choose one of the possible input formats to construct the Tree (Profile, Fasta, or Newick). In our example, we have Profile-based data* so we need to choose the Profile option.
*Profile-based data refers to any allelic profile or similar dataset such as allele count, gene presence/absence or Single Nucleotide Polimorphisms.
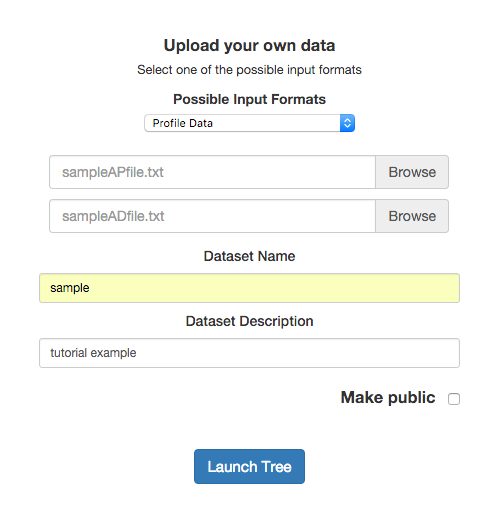
After selecting the input format, the upload selection fields appear. Now we can enter our files, data set name, and description. The first file is the profile one and the second is the auxiliary data.

If users are logged in the application, the Make public option will apear. This allow users to access to this data set from the Public data sets.
After the previous steps, we can now Launch our Tree.
2.1.3 - Public data sets
PHYLOViZ Online allow users to share their own data sets by making them publicly available. Then, others can access to this data in the Public data sets available in the Features menu. When using public data sets, users can not modify but simply explore.
Select public data sets

To access to a public data set, first we need to click on the Public datasets at the Features menu.

Then we have all the publicly available data sets. You have information about its name, owner, and a description. Select one of them. In this case have selected the sample Dataset.
After selecting a data set, we can now Launch the Tree.
Make publicly available
Make your data set available to other users when uploading your files or by creating a shareable link.
2.2 - Data Analysis and Visualization
After uploading files or accessing to public data sets, users are transfered to the Data Analysis and Visualization page of the application. This page is divided in 3 parts represented by different tabs: Tree visualization (Tree tab), Tables (Profiles and Auxiliary data tabs), and Distance Matrix (Distances tab). In the following sections we are going to explore each of them.
2.2.1 - Tree visualization
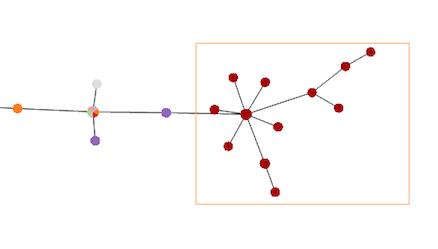
Tree visualization is the default tab that is opened after accessing to the Data Analysis and Visualization page. This tab links to all others using the Features menu located at the page's left side. The Minimmum Spanning Tree located at the center is generated using the goeBURST algorithm and the VivaGraphJS library for visual rendering. The information area located at the bottom shows distinct information on node click depending on the Feature that is selected. Below we have a description of all features.

Assign Colors
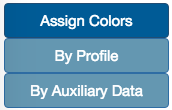
Colors can be assigned to Tree nodes depending on different fields of the input files. Colors can be assign by profile or auxiliary data.
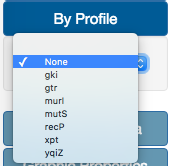
In the color By Profile option, users can select one of the different locus ID in case of profile-based methods. If using Fasta files, locus ID is substituted with nucleotide position. In case of Newick files, this option is not available.
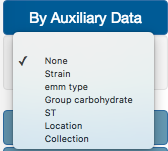
In the color By Auxiliary Data option, users can select one of the different fields available at the auxiliary data file. In our example, we are going to select Strain.
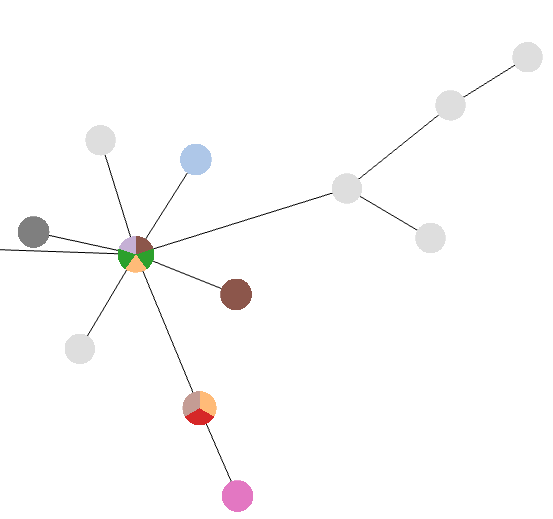
After field selection, a color is attributed to different values of the selected field and nodes are colored according to the data available for that node. In addition, a Pie Chart with global information is also displayed in the Tree visualization tab.
Graphic Properties
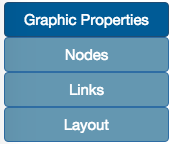
Users can change the graphic properties of the Tree through changes in the properties of nodes, links, and in the force-directed layout.
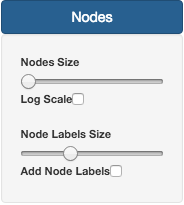
On the Nodes section, it is possible to change Node size and Label size. By default, Nodes do not have Labels activated. To do that, users need to check the Add Node Labels button.
The size of the nodes can also be normalized using the Log Scale option, in case of some nodes having a large number of isolates.
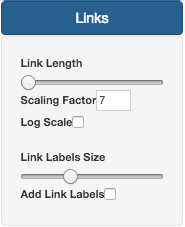
On the Links section, it is possible to change Link size and Label size. Similar to Nodes, by default, Link also do not have Labels activated. To do that, users need to check the Add Link Labels button.
By default, the link length is proportional to the number of differences by its scalability it is not linear. To force or ralax those proportions, you can use the Scaling Factor option.
In case of link representing large distances between profiles, their length can difficult the tree visualization. In those cases, users are recommend to select the Log Scale button, to facilitate the large tree visualization.
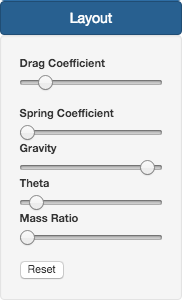
Regarding the Layout section, there are a series of parameters that can be changed:
- Drag force coefficient: Slows down animation speed and the closer two 0 the farthest the nodes will be.
- Hook's law coefficient (Spring coeficcient): Closer to 0 links are more loose.
- Gravity: Negative numbers lead to nodes repel.
- Theta: Controls the openning angle used to calculate the force layout. As the Theta value increases, the opening angle is reduced, thus merging the closest nodes with the overall effect of uncluttering the display.
- Mass Ratio: Bigger values lead to more attraction between nodes.
All changed can be placed back to the default state by pressing the Reset button.
Node selection
Single node selection or Multiplenode selections can be made. Single selection is made holding the Ctrl key and clicking on the desired nodes. The Multiple selection in made by holding the Shift key and dragging the cursor over the nodes (image on the left).
To clear all selections, simply press the Shift key.
Node selection is a requirement for Distance Matrix calculation and for exporting the desired data from the Tree.
Search/Pause/Reset/Zoom
Users can search for a given node by its identifier by its identifier (the first column in the Profile/Fasta/Newick files). After performing a search, the Layout pauses and the application zooms into the desired node (if exists).
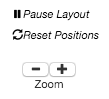
Users can pause and resume the layout whenever they want using the Pause/Resume Layout button. The Tree can also be placed back to its inicial place using the Reset Positions button.
Users can also zoom the Tree using the Zoom buttons.
Export
After selection of some nodes, users can export this selected data by clicking on the Export Selected Data located at the Operations section. The results are two files: one with the profiles and other with the associated auxiliary data.

The Tree can also be exported simply by selecting the Save Image button. This opens a new window with only the relevant information for users. Only the visible part of the Tree or the current area selected using Node selection is exported. If users have assigned colors to the Tree, then the Pie Chart legend information will also be exported.
2.2.2 - Operations
PHYLOViZ Online offers some aditional features that modify some aspects of the Minimum Spanning Tree or Newick Tree, and others that allow users to share data without making it publicly available, only reachable through a shareable link.
n Locus Variant (nLV)
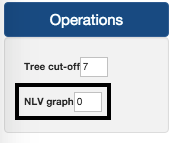
The nLV feature can be accessed in the Operations section. The values range from 0 to the maximmum number of differences between profiles on the analysis. In the case of Newick input data, this option is available in other name, the Cluster Nodes option. This tool creates links between any nodes in the graph with differences up to and including number entered in the box.
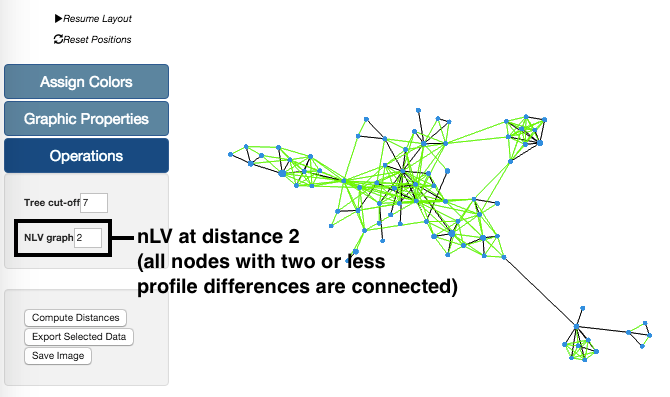
In this example, we have taken our sample data set and generated the graph with a nLV of level 2. This means that all profiles with distances equal or below 2 are now connected. These changes in the Tree can be undone simply by reducing the level of the nLV feature.
Tree cut-off
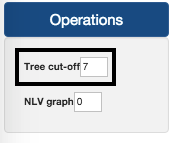
The Tree cut-off is also available in the Operations section. Its values range from 0 to the maximmum number of differences.
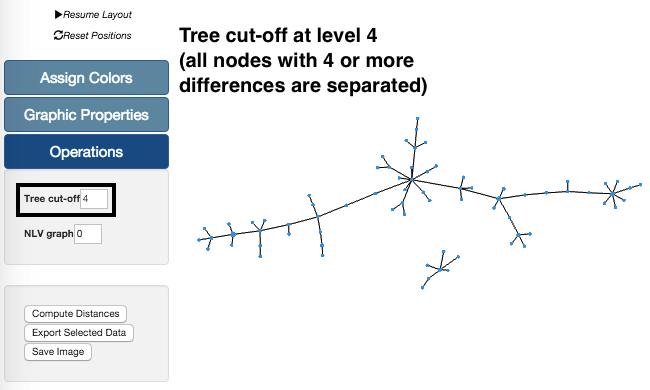
In the example on the left, we are again using our sample data set. Using the Tree cut-off at level 4 we can see that there are two groups. These groups are separated because all links between nodes with profiles with 4 or more differences are deleted. These changes in the Tree can also be undone by increasing the level of the Tree cut-off feature.
Shareable link
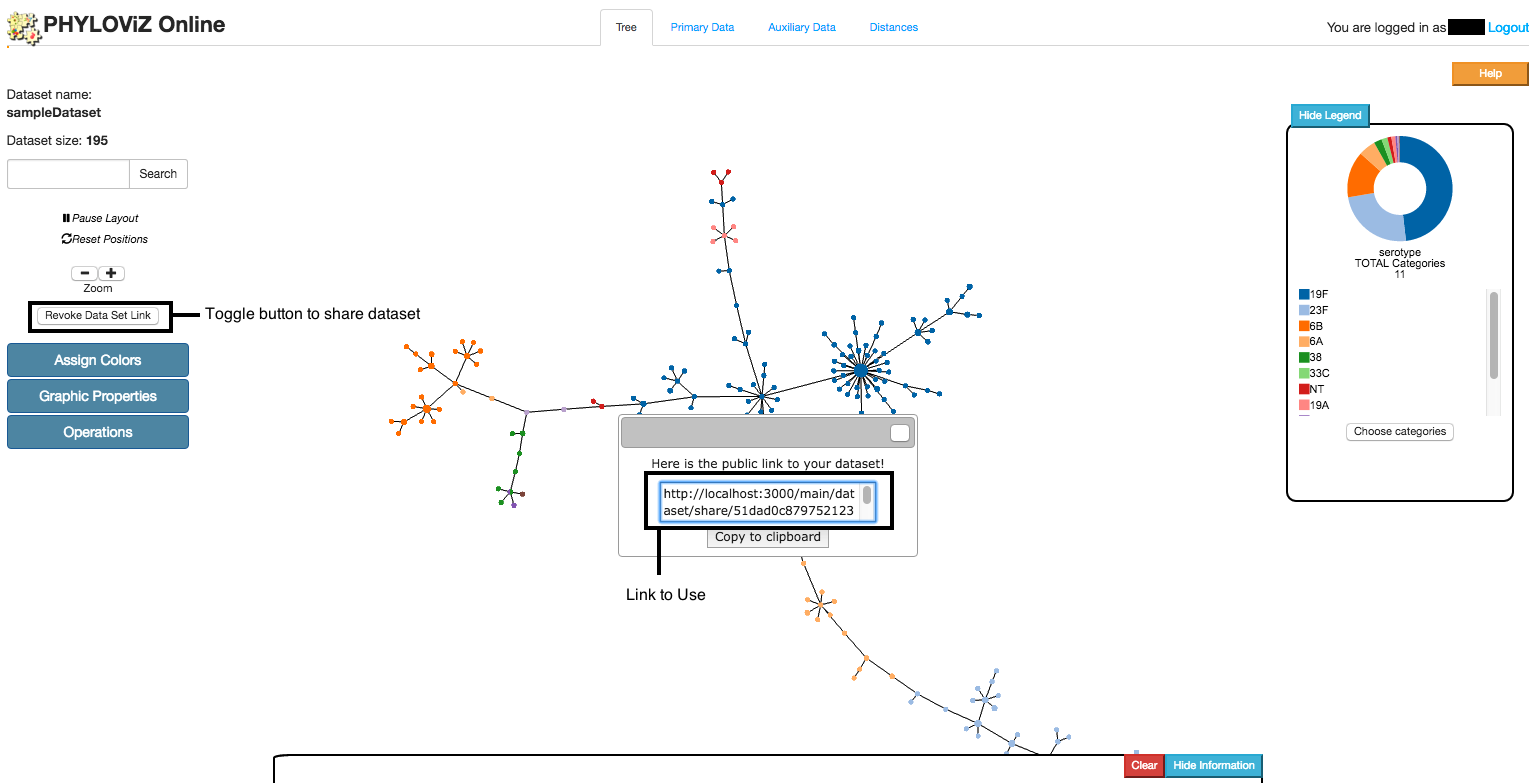
Users can allow others to visualize their data by creating a shareable link. This option is intermedian to to a public data set because the data set is not available to all, only to the ones how have the shareable link. At any time, the owner of the data can allow or revoke this access by clicking on the Generate/Revoke Data Set Link. Once generated, the shareable link gets available to the user.
2.2.3 - Tables
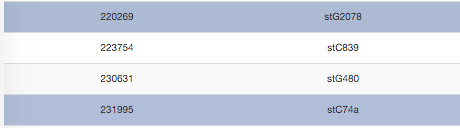
In addition to the Tree Visualization, PHYLOViZ Online also displays input data in Tables. It shows the Profile data (if input file is profile-based) and Auxiliary data (if existing). Users can explore, filter information, and link selected data from the tables to the Tree.

Filter
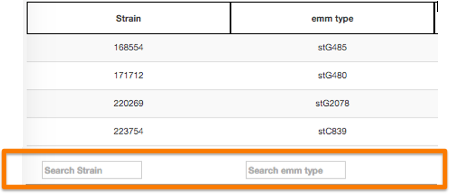
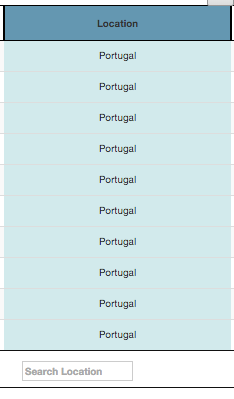
It is possible to filter information by performing queries on the data available in the table column. Users can also query on multiple columns simultaneously. Advanced users can also use regular expressions (regex). To do this, just place a pattern on the search area at the bottom of each column.
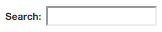
The Search area on the upper right side of the table can also be used to filter information from the table. However, in this case, the search is made globaly and not by column.
Link to Tree
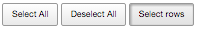
The query results can be visualised directly in the tree by using all data available at a given instance or some selected rows. By default, selection is made by single rows. However, the selection of all rows can be made using the Select All button. To deselect, users can press the Deselect All button.
Single row selection is made by pressing the Ctrl key and clicking on the desired rows. Again, to deselect, users can press the Deselect All button.
To be able to link data from the table to the Tree, first there is a need to choose a column from the table to be mapped. This is made by clicking on the table's column header. After column selection, it gets highlighted and a Pie Chart shows up below the table.
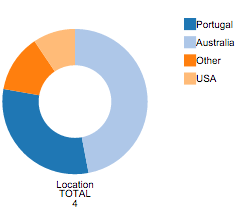
The Pie Chart that appears after column selection has global information on that column. Each color represents a different value and counts for each value are available. On mouse over each region of the Pie Chart, the counts for the desired filed value are given.

The last step that takes to perform data linkage from the table to the Tree is clicking on the Link to Tree button. After this, users are redirected to the Tree Visualization tab and nodes are colored according to the selected field from the table.
Export
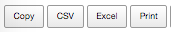
It is also possible to export the data from the table on a Excel and CSV format. This is made by selecting one of the export options at the upper left of the table.
2.2.4 - Distance Matrix
In addition to the Tree Visualization to represent distances between nodes, PHYLOViZ Online also offers the interactive Distance Matrix visualization, which represents the All vs All distances between nodes selected from the Tree tab using Node selection. It also displays information about each comparison and t is possible to order the matrix data according to the existing fields in the auxiliary data.

Compute distances

The distance matrix is not generated by default. To create the matrix the user has to previously have defined a node selection in the Tree Visualization. After node selection, users can click on the Compute distances button, located at the Operations menu, that will redirect them to Distances tab of the application.
Order
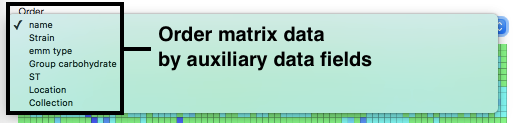
By default, the Distance Matrix is ordered by identifier. However, Users can choose to order it by any field present in the auxilary data. This can help to show the clusters created due to the categories/values defined in the auxiliary data.
Select/Export
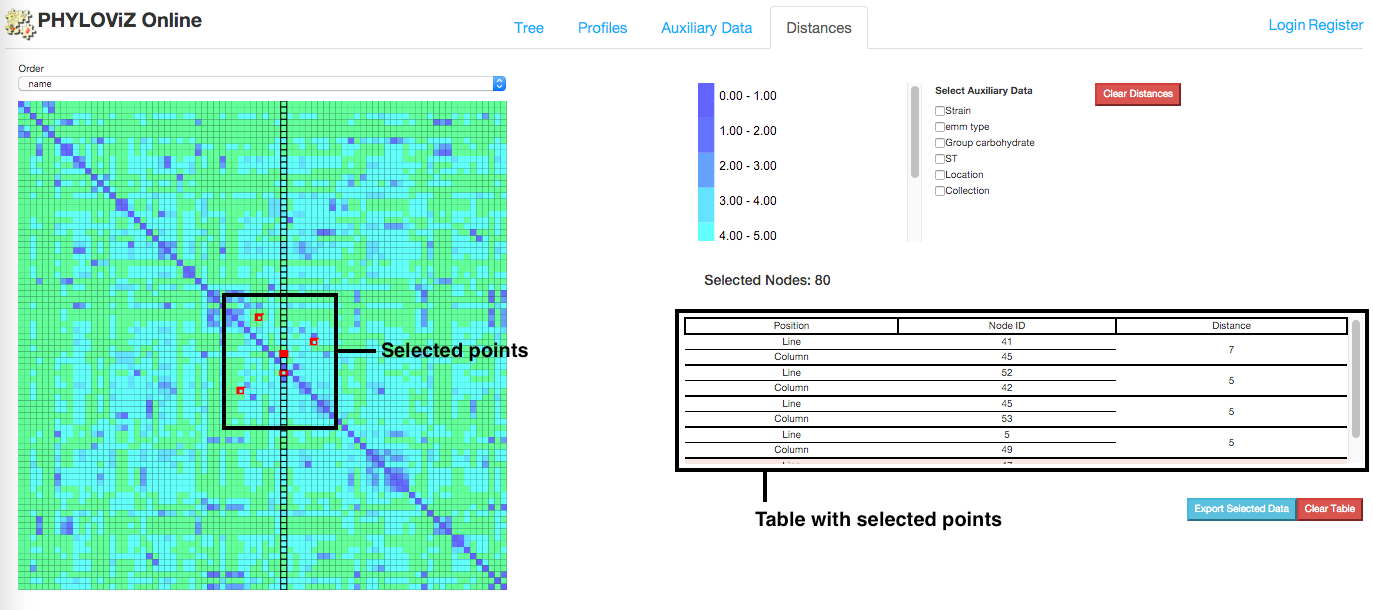
On mouse over the distance matrix cells, information associated with them is displayed in the information table. Users can see the distance between pairs of nodes and their auxiliary data, which fields can be filtered using the checkboxes above the table. Multiple selections can be made and stored in the table for analysis.

Information displayed in the table can also be exported in the way of two files: profile and auxiliary data file. Only information from selected cells is exported.
2.2.4 - Sequence Viewer
PHYLOViZ Online also offers a way to visualize multiple alignments after node selection from the Tree, the Sequence Viewer, implememnted using the BioJS MSA Viewer package.
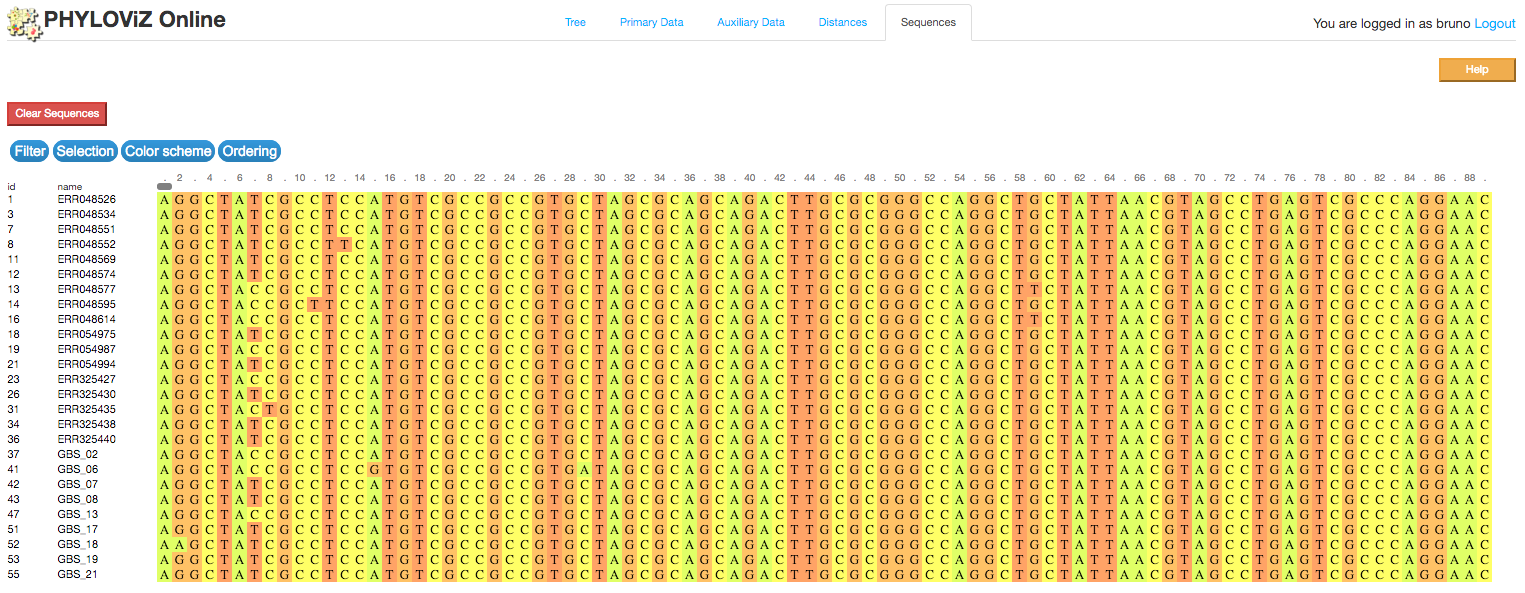
Filter

Filter the sequences or sequence positions you want to see by identity, treshold or by previous selection. Simply click on the Filter button on the upper-left side of the visualization.
Select
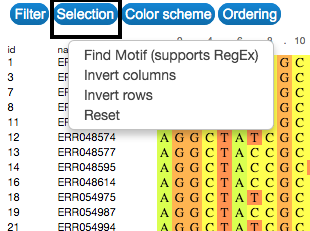
Explore and select the sequences by searching for a specific motif. This can be done in the Selection button on the upper-left side of the visualization. Selection can also be made by clicking on the name or id of each sequence.
Colour
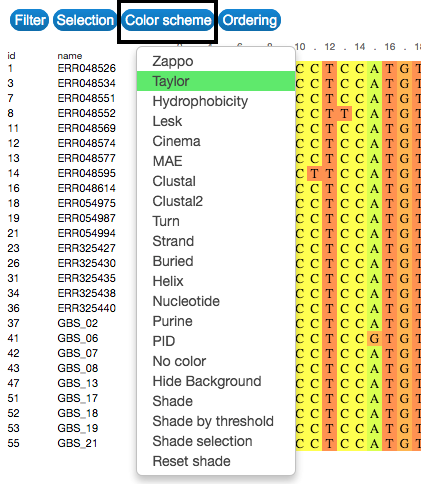
Change the colour of the visual representation according to sequence characteristics. To do that, click on the Color scheme button on the upper-left side of the visualization.
Order

Order the entries according to characteristics of sequences, such as their labels and identity. To do that, click on the Order button on the upper-left side of the visualization.